
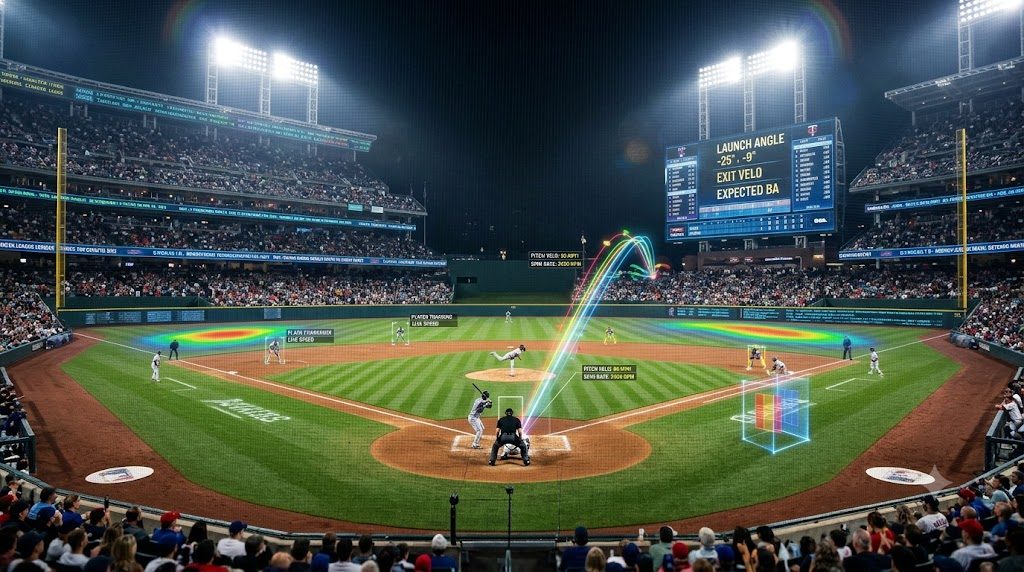
From Broadcast to Dashboard
The idea of a fan relaxing with a beer while a three-hour baseball game plays in the background is out of date. Viewers now split their attention across several screens. The original Moneyball movement changed front offices by using data to find market inefficiencies, and now the same kind of data reaches fans directly. Many viewers watch like amateur analysts, with a tablet or laptop open and an appetite for real-time numbers. Broadcasters stopped fighting the second screen years ago. Leagues and networks are now building products designed around it.
Twelve Cameras and the End of the Eye Test
Major League Baseball replaced its radar-based tracking with Hawk-Eye optical tracking in all thirty ballparks in 2020. The system uses twelve high-resolution cameras around each stadium, and MLB has since added high-frame-rate capture of up to 300 frames per second to track bat speed and swing path. It’s a cloud-based computer vision system that records the movement of the ball and players in fine detail, logging hundreds of thousands of pitches and batted balls every season. All that video would be useless without serious computing power to process it.
Machine learning and stream processing pipelines handle that data in real time. Frameworks like Apache Flink can process tracking data with sub-second latency, which is how on-screen graphics appear almost as soon as the pitch is caught. Computer vision can now estimate a player’s body position in 3D from video alone, without wearable sensors. Algorithms can measure a pitcher’s knee flexion, shoulder angle and hip rotation, and researchers have shown that body movement alone can predict the type of pitch with useful accuracy before the ball is released. Medical staff use similar biomechanical data to spot warning signs of elbow injuries that can lead to Tommy John surgery, and much of the general tracking data is shared with the public.
Making Use of the Downtime
Baseball has always had a pacing problem: short bursts of action separated by long stretches of batters adjusting their gloves. That downtime has turned into an advantage. The gap between pitches gives broadcasters time to process and show detailed data, and the league has taught fans a new vocabulary to fill it. An at-bat is no longer judged only as a hit or an out. Fans look at the quality of contact. A batter might hit a line drive straight at a well-positioned shortstop, which goes down as an ordinary out. But viewers see a 109-mph exit velocity and a high expected batting average (xBA) on screen and know the swing was excellent, even if the result wasn’t.
Statcast’s bat tracking, introduced in 2024, added even more detail. A swing of 75 mph or faster is classified as a fast swing, and a “blast” combines a fast swing with squared-up contact. Pitchers have their own metrics. A “sword” describes a swing so badly fooled that the batter ends up with an awkward, defensive half-swing. Fielders are measured with Outs Above Average, which accounts for how far a fielder had to go, how much time they had and how likely the catch was. This vocabulary shifts attention away from single results and toward long-term probability.
Betting on Every Pitch
This kind of detailed data feeds the second-screen economy. For many fans, the phone has become the main dashboard and the TV the backdrop. Some fans follow live MLB odds as a way to test their read of the game against the market. Sportsbooks have built products around that engagement, and micro-betting is the clearest example. Instead of only betting on the final result or the total runs, bettors can wager on what happens next, such as whether the next pitch will be a ball or a strike, or whether the batter will strike out.
These markets depend on the same fast data feeds that power the broadcast graphics, which let sportsbooks close betting before each pitch. Companies like Simplebet, which DraftKings agreed to acquire in 2024, combine historical statistics with live game data to price these markets in milliseconds. Pitch-level betting has also drawn scrutiny. In November 2025, after two pitchers were indicted on charges of rigging individual pitches for bettors, MLB and its licensed sportsbook partners agreed to cap wagers on individual pitches at $200 and keep them out of parlays, to reduce the incentive for misconduct.
Predictions on the Main Broadcast
Broadcasters still want to reach viewers who aren’t looking at their phones, so they’re adding predictive numbers to the main broadcast. Augmented reality graphics now place live probabilities on the field. Apple’s Friday Night Baseball broadcasts, for example, showed real-time figures such as a batter’s chance of reaching base, using data from third-party providers like nVenue. These models don’t always hold up. Baseball has a lot of random variation, and simple models can struggle to keep up in real time.
A general-purpose model might give a weak hitter strong odds of homering because he once went 7-for-11 against a Cy Young winner. That’s a tiny sample, and leaning on it is a classic case of overfitting. It also ignores factors like wind, defensive positioning and late-game fatigue. Knowledgeable fans spot these errors quickly and point them out on X and Reddit. Many viewers now understand data well enough to question a broadcaster’s models, not just the umpire’s strike zone.
Fans Inside the Data
Teams are also using this data to shape their marketing. Clubs track fan sentiment online, but off-the-shelf tools often misread sports slang. A generic language model might tag “that slider was absolutely filthy” as negative, when the fan is actually praising the pitch. Some teams have trained custom models on game-thread language so they can read the crowd’s mood more accurately and adjust in-stadium promotions to match.
Spatial computing will push this further. Early apps for the Apple Vision Pro let fans view pitches as 3D renders from behind the plate. The graphics were sometimes rough, with fielders glitching during complex plays, but the direction is clear. Baseball is still a physical contest played on grass, but for many fans it’s also a live data puzzle built from tracking feeds and predictive models. Watching a game increasingly means reading it.

Passionate about exploring diverse ideas and sharing inspiration, I curate content that sparks curiosity and encourages personal growth. Join me at ElementalNest.com for insights across a wide range of topics.