
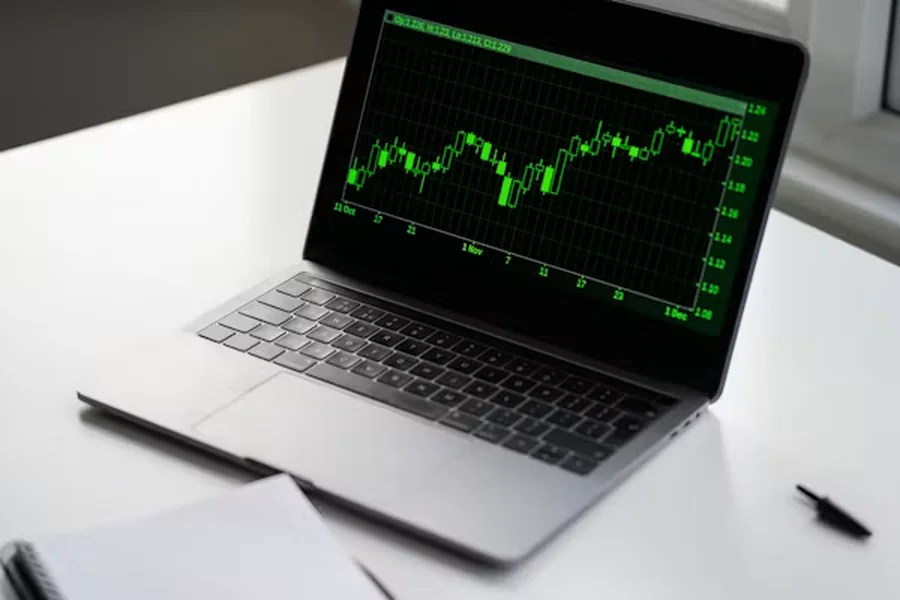
Markets can appear calm at the index level while individual stocks move sharply beneath the surface. Volatility describes the size and speed of those price changes, but it is not the same as loss. Understanding what is moving, over what period and why gives investors a clearer view of risk.
Why does volatility matter even when the market is rising?
A rising market is not automatically a quiet one. Prices can advance while individual shares experience large daily swings, especially when earnings surprises, interest-rate expectations or sector-specific news change quickly.
Understanding what is market volatility? helps put those movements into context. Volatility describes how much and how rapidly prices move over a defined period, whether in a single stock, a sector or the broader market. Higher volatility means larger or more frequent price changes, while lower volatility indicates a narrower trading range.
This distinction matters because volatility measures movement rather than direction. A stock can rise sharply one day and fall the next while ending the period close to where it started.
What can cause volatility to increase?
Volatility often rises when investors must reassess information quickly. Common triggers include:
- central-bank decisions and changing rate expectations;
- company earnings or revised guidance;
- inflation, employment and growth data;
- geopolitical events;
- commodity or currency shocks;
- changes in market positioning or liquidity.
Volatility can therefore increase even when the underlying economy has not suddenly changed direction. Markets continuously adjust prices as expectations about future conditions evolve.
Why can index volatility hide what is happening underneath?
Market indexes combine many companies, and those stocks do not always move together. Gains in one group can offset declines elsewhere, reducing the apparent movement of the overall index.
Recent analysis has shown how major indexes can remain relatively calm while individual stocks experience much larger price swings. When correlations between stocks are low, sharp gains and losses can effectively cancel each other out at index level.
Looking only at the daily change in the S&P 500 or another benchmark can therefore provide an incomplete picture. Sector performance, market breadth and stock-level moves may tell a different story.
What does the VIX actually measure?
The Cboe Volatility Index, commonly known as the VIX, is often described as a market “fear gauge.” Rather than measuring past price moves, it uses options prices to estimate expected volatility in the S&P 500 over roughly the next 30 days.
A rising VIX generally indicates that options traders are pricing in larger potential swings. A falling reading suggests expectations for more subdued movement.
However, a low VIX should not automatically be interpreted as an absence of risk. Recent market analysis has highlighted situations in which measures of market fragility can rise even while headline volatility remains subdued. Volatility indicators are therefore more useful when read alongside economic conditions and the behaviour of individual stocks.
How is volatility different from investment risk?
Volatility and risk overlap, but they are not identical. Volatility measures price variation. Investment risk is broader and can include permanent loss of capital, weak liquidity, excessive concentration, leverage or the possibility that money will be needed during an unfavourable period.
A temporary decline may represent significant volatility, but its practical impact depends on the reason for holding the asset and the intended time horizon. A short-term position and a long-term investment can interpret the same price move differently.
What questions help put volatility into context?
Before reacting to a sharp market move, a structured review can consider:
- Is the movement affecting one stock, one sector or the broader market?
- Has the underlying economic or company-specific information changed?
- Is liquidity deteriorating or are trading conditions still orderly?
- Does the move conflict with the original time horizon and reasoning?
- Has the position become too concentrated?
These questions do not predict what happens next. They help distinguish a change in price from a change in the original investment case.
What is the main lesson?
Key takeaway: volatility is a measure of movement, not a verdict on whether an asset is good or bad. Large price swings can reflect uncertainty, changing expectations or temporary imbalances, while quiet markets can sometimes conceal substantial differences between individual stocks.
A disciplined interpretation looks beyond a single index or daily percentage move. Time horizon, market breadth, underlying information and total exposure provide the context needed to understand what volatility is actually saying.

Passionate about exploring diverse ideas and sharing inspiration, I curate content that sparks curiosity and encourages personal growth. Join me at ElementalNest.com for insights across a wide range of topics.